Results shown to audience


Presentation and Analysis of Voting Results


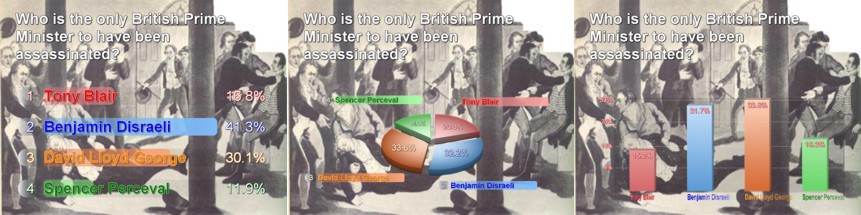
The Interactive Presenter accepts audience polling input at the high speed rate of 300 votes per second.
All responses are instantly processed by the computer deliverying the presentation.
The results become immediately available to be shown to the audience and commented on.
They can be presented in a number of different ways.

A variety of the ways to show how the audience polled


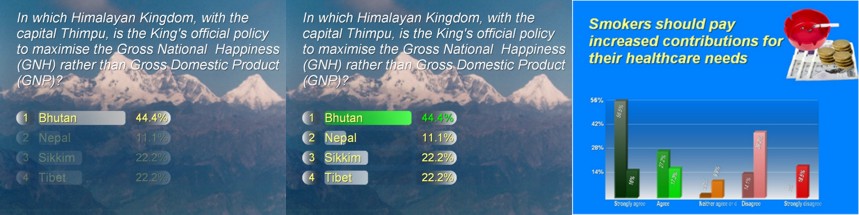
               Horizonal Bar Graph                                                   Pie Chart                                                Vertical Bar Graph Different Ways to Present the same voting Results
In this example, the voting results may been shown in three different graphical forms - in a bar chart, in a 3D pie chart or a 3D vertical bar chart.

There's a variety of ways of presenting both questions and the resulting voting outcomes to an audience with the Interactive Presenter,
To help clients and users review the options we have published a question guide in two parts on the web, you can reach their download page by clicking here..


and the implications of the way they voted

              Fade Out Wrong Options                                    Highlight Right Option                              Compare audience votes Right answers & comparative results shown against audience votes
The most obvious implication will be to show where there are right and wrong answers.
You might also want to show how the audience vote compares with another group or how an audience vote on the same question changed between the beginning and the end of an event or a presentation.

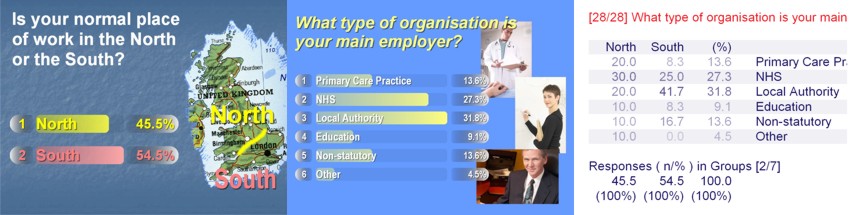
show how different voting profiles compare

       Asking a profiling question                                      then another                                       & compare the two results You can use early votes to profile audiences and  then show how the different profile groups subsequently  vote
With background or profiling questions set, you are in a position to compare how groups within the audience, who voted one way on one question, subsequently voted on another. In the example shown, you can see that although 31.8% of overall delegate work for Local Authorities, the percentage in that category from the South of the country was virtually 10%t higher.

Change the order to show the significance or have visual options

       Turn a random priority vote                                      into its logical order                    or show voting results of graphical options Screens showing priority and visual votes
If you ask your audience to voting for their priorities on an issue, the vote can be made more meaningful to the audience by listing it in the resulting priority order.
the third results demondtrates that you can get ask an audience to vote on a visual as well as a verbal question and then show them the results.


Responses can be captured in data as well as graphical format

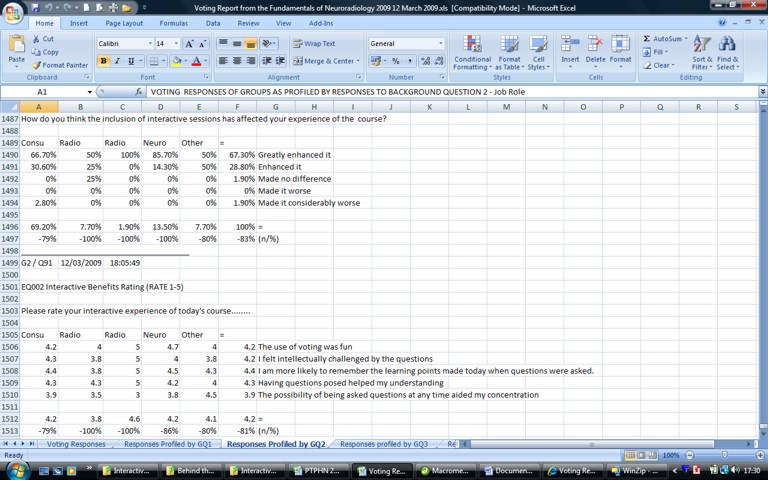
The Interactive Presenter™ captures audience voting results in both graphical and data forms.
You can choose to display or not display the responses on-screen. The choice you make will depend on what is best for the objectives of your presentation.
All data captured can be easily analysed afterwards usually through automatically exporting it to other very familiar applications like Excel for further manipulation.

Example of Voting data imported into Excel


Peak Performance Logo About Us | Site Map| Contact Us | ©2009 Peak Performance & its licensors